Uganda Flying Labs Trains Students to Collect, Analyze Drone Data
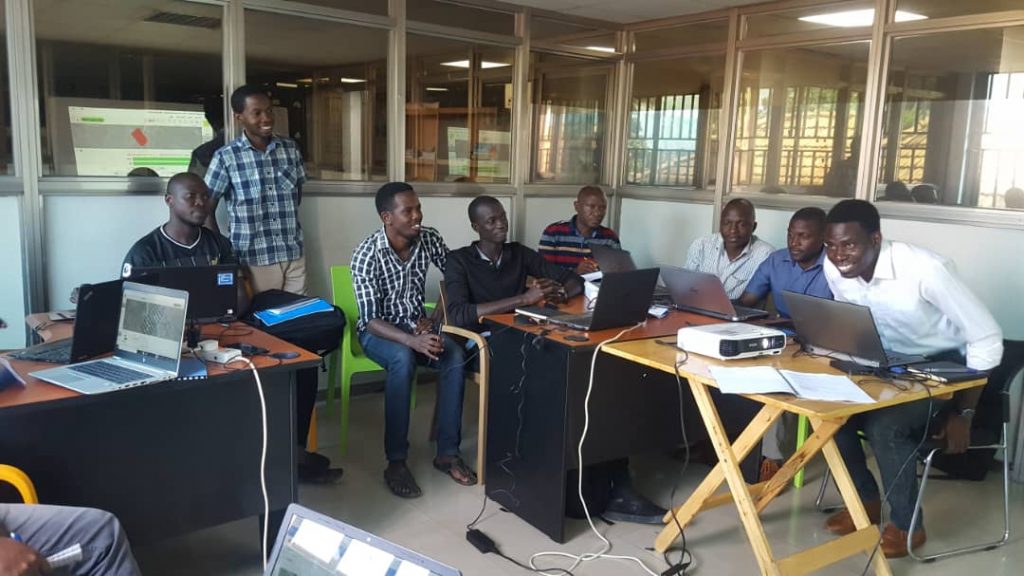
After the training, participants were ready to start working with drones and data analysis to better undertake their tasks in their different fields.
October 22nd, 2019
In late September, Uganda Flying Labs held an intermediate drone training, a hands-on opportunity to fly the drone and analyze data using Pix4D and QGIS. On the first day, our primary goal was mission planning and capturing as much imagery as possible. With everyone getting a chance to help with the mission plan, we set off for the field in Kitale village, Namilyango parish, and the weather suddenly changed.
A torrential downpour set upon us and the flying ceased. We used this opportunity to teach the curious participants about the controller, the different settings, and their respective responses in connection with the drone. This kept everyone busy and distracted from the weather until the clouds cleared.
When the rain stopped, we were ready to fly. The participants, ranging in occupation from surveyors to electrical engineers, to GIS experts and programmers, were split into groups of three, each group having someone from each field. Having different expertise in the different was beneficial as knowledge and ideas were shared as a team. Everyone in the group took part in the flying, taking turns as pilot, co-pilot, and observer. Each team member was thus given adequate time for a chance for everyone to fly and capture an image.
With our imagery ready, we were set for day two: analysis. Day two took place at Uganda Flying Labs Premises at Hive Colab. This started with the installation of Pix4D and QGIS for some participants who did not have it installed yet. There was a brief presentation about what to expect at the end of the analysis.

Following a step-by-step demo, the images were uploaded to Pix4D to generate a report that stitched the photos together to show the area of overlap and the flight path.
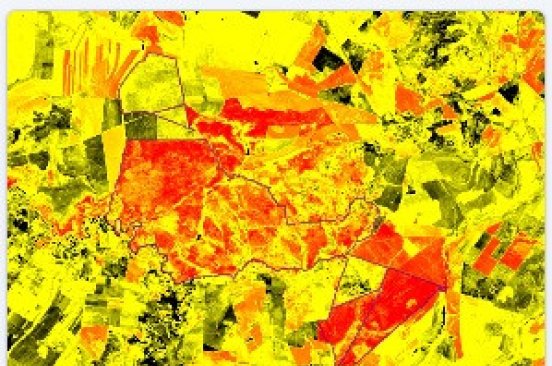
The image overlap was excellent. Most of the areas had a green color, showing more than five images overlapped, proving that the mission plan was well executed. From the analysis, we were able to get the orthomosaic and digital surface models (DSM).
The DSM and Orthomosaic were added to QGIS as raster layers for further analysis. In the QGIS processing toolbox, the aspect, hill shade, and slope were some of the features that were analyzed. Elements were classified into buildings, roads, utilities, which included the electricity poles and lines as they were being identified in the orthophoto and shapefiles generated. This session was very engaging as the participants saw their imagery come to life on the orthophotos vividly.
With this outcome, the participants were ready to start working with drones and data analysis to further better their duties and responsibilities in the different fields.
Category(s)
Recent Articles
View All »

AfriGEO 2025: How Senegal Flying Labs is Helping Shape Africa's Geospatial Future
