When the Dam Breaks: Using GIS Data For Flood Disaster Preparedness
What happens if a dam overflows? Who would be affected by the floods? What areas are at risk? How many buildings would be destroyed?
September 8th, 2021

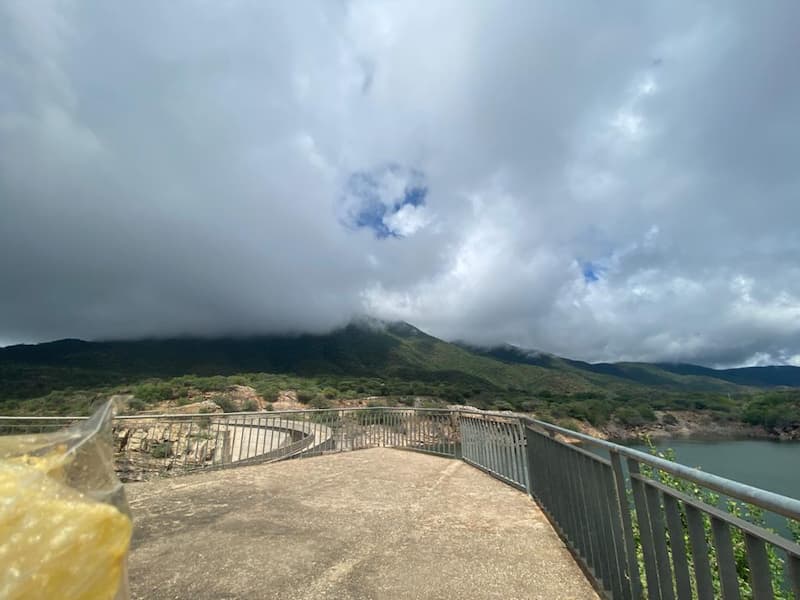
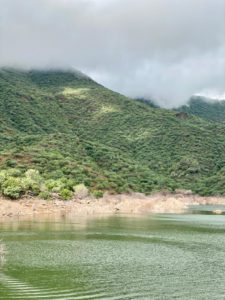
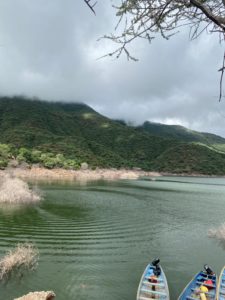
Turkwel Dam—also known as Turkwel Hydroelectric Power Station—is located along the Turkwel River in West Pokot County, Kenya. The dam is a source of electricity, fishery, and tourism. With a height of 153 meters, it’s the tallest dam in Kenya. Its crest length is 150 meters, with a dam volume of 170,000 cubic meters and a water retention volume of 1,641 million cubic meters.
Despite its impressive size, the dam is on the verge of overflowing. Due to excessive rainfall in the nearby Mt. Elgon Catchment area, the dam recorded its highest water level of about 147.72m (October 2020), leaving less than 3m left before overflowing. About 16,000 people live in the Turkwel basin and are at imminent risk of flood should the dam fill up and overflow. Therefore, there is an urgent need to conduct a flood risk and vulnerability assessment and model the area in preparation for a potential calamity.
 We initially planned to use high-resolution drone data to model the basins affected in the event of flood accurately. However, we could not get a permit to operate a drone due to past incidents of terrorism in the area linked to this technology. As a result, we used satellite data to study the reservoir and created 3D models to visualize flooding in the basin.
We studied and mapped out the change in water levels at the reservoir using Sentinel 1 satellite images captured in October 2020, when the dam had increased water levels. In January 2020, the month with the lowest rainfall. A few fish farmers living around the dam are the most vulnerable to potential flooding.
We aimed to answer the looming questions: what happens if the dam overflows? Who would be affected by the floods? What areas are at risk? How many buildings would be destroyed?
 Using QGIS open source software and SRTM Data, we created an inundation map to address each of these questions. Creating the Digital Elevation Model of the whole Turkwel catchment area gave us an idea of how the water will flow in floods. Hence, we identified the basins that would be affected, assuming all other factors remain constant. We created flood maps of the Lodwar basin, one of the basins in the Turkwel region, at various depths. We also extracted building footprints of the area to show the expected magnitude of damage to buildings.
The County Government of West Pokot will use this project to approximate flood volumes and extent and estimate the vulnerability of the nearby community and buildings to potential floods. Additionally, the model will identify the evacuation routes and locate the shelter points during rescue operations. The County Government of West Pokot is happy to integrate drone operations in their future projects.
Category(s)
Recent Articles
View All »

Wildfire Assessment and Web Application in Sao Paulo
