By Japan Flying Labs
 国土地理院 (Geospatial Information Authority of Japan), CC BY 4.0, via Wikimedia Commons
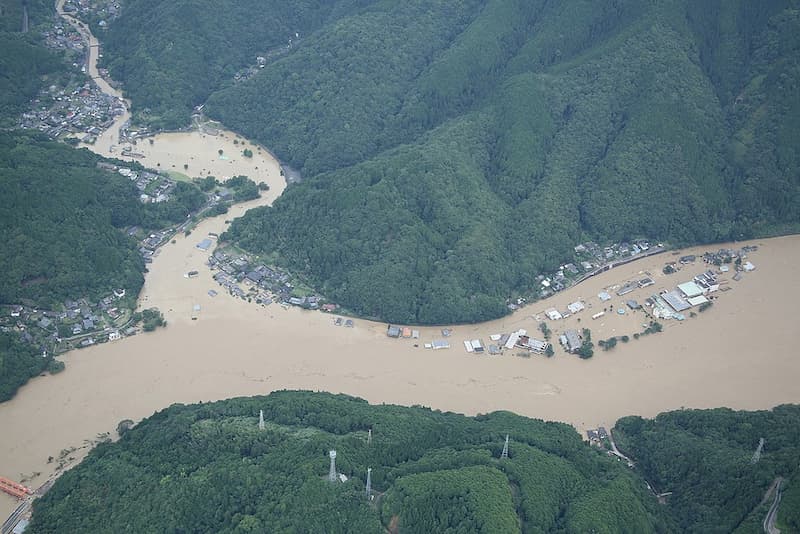
Flooding damage throughout Japan has been increasing again this year. Torrential rain by a linear rainband in early July caused extensive damage from floods and landslides in several prefectures, including Hitoyoshi City in Kumamoto Prefecture.
Realizing the seriousness of the situation, Japan Flying Labs deployed to support the crisis mapping activities. With many other partners and thousands of volunteers, we started by mapping buildings in Hitoyoshi City, downstream of the Kuma river area and Ashikita Town, severely damaged by Kuma River’s flooding.
 Image: Crisis Mapping Projects on Tasking Manager
Once the crisis mapping task projects were up and running, many mappers jumped onto the task, including students and YouthMappers AGU members led by the Furuhashi Lab of Aoyama Gakuin University, the OpenStreetMap Japan Slack team, and KumaMCN (the Kumamoto technology group). HOT members and Mapbox Minsk contributed from overseas as well. By 11 August 2020, 1,866 people had worked on five crisis mapping projects to map almost all buildings in the areas. In this blog post, we share our contributions to one of these crisis mapping projects.
 Task # 9023 - Progress of the Kuma River flood mapping project, more than 80% of buildings completed within five days of the start
The aerial photos used in this building mapping were the map tiles of the latest national aerial photographs (seamless) by the Geospatial Information Authority of Japan, taken between 2004 and 2009, more than ten years ago. We also used the latest MAXAR images, which had low resolution but dated from before the disaster. We assumed that Japan’s Geospatial Information (GSI) Authority would release the post-disaster ortho-mosaic data during our mapping. GSI gradually released "oblique photographs," and we used them as reference. But as of August 31, 2020, we realized that our assumption on the ortho-mosaic data was wrong. (Information on heavy rain in July 2nd year of Reiwa).
 (Diagonal photo) Kurume district (Kurume City, Fukuoka Prefecture, Chikugo City, Okawa City, Ogori City, Ukiha City, Asakura City, Tachiarai Town, Oki Town, Hirokawa Town, Tosu City, Saga Prefecture, Kanzaki City, Kamimine Town, Miyaki Town) (7/8 shooting) // www.gsi.go.jp
The purpose of crisis mapping is the rapid mapping of post-disaster damage based on post-disaster aerial images. Because DRONEBIRD, a partner of Japan Flying Labs, did not have disaster agreements with local governments, taking aerial images was impossible. When GSI released the oblique photos, we should have done ortho-mosaic processing and deployed in OpenAerialMap, instead of waiting for the GSI to release the ortho-mosaic data.
While there were challenges, the fact is that more than 1,800 crisis mappers contributed to enrich the granularity of OpenStreetMap data mapping 65,000 buildings, and the projects indirectly assisted rescue teams and disaster volunteers working in the field.
Below we explain how mapping data can contribute to crisis mapping activities in the field:
1. Maps for information on roads and traffic
 ITS Japan 通行実績情報 2020年
It is crucial for rescue teams to know which roads are accessible or not. After the Great East Japan Earthquake, an increasing number of companies such as Honda, Toyota, and Pioneer quickly released traffic data extracted from car navigation systems. Now, ITS (Intelligent Transport System) Japan, which compiles data from all companies, is ready to release traffic information in the event of a disaster and uses Geospatial Information Authority of Japan’s maps and OpenStreetMap as its background maps. The ITS Japan traffic information is divided into two categories, "small trucks" and "large and medium-sized trucks,” making it possible to check routes separately from small passenger cars. We share this information daily with the organizations we work with as soon as it’s made public.
2. Base map for volunteers to make grassroots information maps for local people
 まちケア
まちケア
An important aspect of volunteer work in disaster areas is listing current evacuation status and the town’s recovery and reconstruction status. Grassroot information maps are separate from maps provided by official organizations or government. One of our crisis mapping data’s quickest users is "Machi-Care," an improved version based on "Mabi-Care," which was utilized in Mabi Town during the 2018 West Japan torrential rainstorm disaster. They use OpenStreetMap as a base map. POIs data (point-of-view information) of evacuation centers, pharmacies, medical facilities, senior care facilities, and home centers were categorized and shared.
3. Base map for apps: MAPS.ME, Strava, Mapillary
Unfortunately, due to COVID-19 this year, local governments may not accept volunteers outside their prefecture in case of disaster. But for volunteers in the field, these three smartphone apps are beneficial:
MAPS.ME
There may be power outages and disrupted communication networks during and after disasters, reducing smartphones’ value and no access to Google Maps, as most navigation apps are designed to be used online. An advantage of OpenStreetMap is that it can be copied and distributed. That’s when MAPS.ME becomes interesting. By downloading the map to your smartphone before you head out into the field, your smartphone acts as a car navigation system with a detailed navigation map accessing GPS.
Strava
It's challenging to keep track of where we went, what we did, and share this openly. Strava developed to track your running and cycling can become a great tool to track all your movements in the field.
Mapillary
Mapillary, a street view photo-sharing platform, is an excellent way for citizens to share information for damage assessment. Pictures and location, the direction of the camera, timestamps, and object recognition through machine learning, and point cloud data generation are done automatically. Based on these photos, the Crisis Mapping team will get the latest information to update the map.
Aside from these apps, the weather information app Windy displays a range of weather information overlaid on top of OpenStreetMap, which can help ensure field operations safety. It is an indispensable app for the disaster drone rescue team DRONEBIRD to conduct safe drone flights by checking the wind speed at different altitudes.
 Windy で現地の風速や降雨量など気象情報を確認する。
I'm sure that local volunteers, people affected by the disaster, and various organizations involved in the recovery and reconstruction efforts are also using OpenStreetMap as well as Google Maps. If you know of any other use cases (of OpenStreetMap), we would love to hear about them.
Because OpenStreetMap is available for commercial use and can be copied freely, it is often used in ways that volunteer mappers could never have imagined. Maybe you're using OpenStreetMap through some tools every day without knowing it! Twelve years have passed since the OSM community was established in Japan, and I feel that OpenStreetMap is now commonly used as a base map.
This is not the end of the crisis mapping projects. Areas that have experienced flooding are subject to more floods or landslides in the future. There are also many areas damaged severely that Crisis Mappers did not get to this time.
By comparing our predecessor's knowledge of hazard maps and the disaster area, we will anticipate similar disasters likely to happen soon. To create maps quickly and effectively, we will continue to expand our grassroots crisis mapping activities, tackling the many unsolved issues one by one.
Lastly, I would like to thank all the volunteer mappers who contributed in various ways to the July 2020 Torrential Rainfall Crisis Mapping event:


